Cross-Asset Correlation Analysis: Making Sense of the Market’s Hidden Connections
5 min read
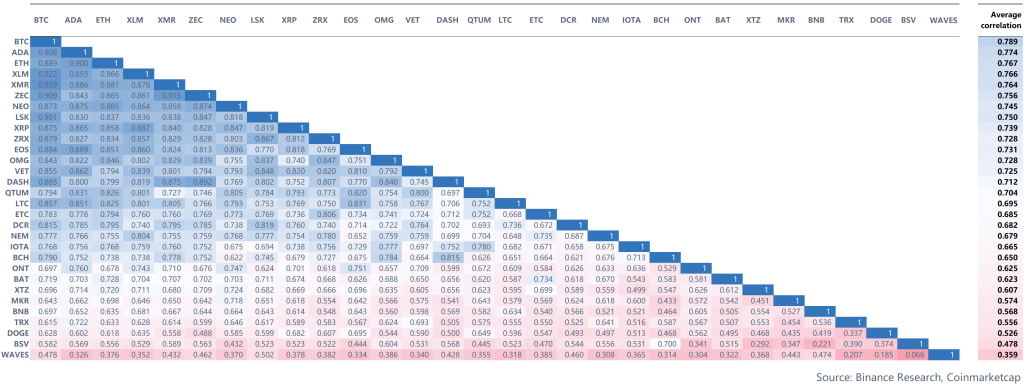
You know that feeling when one domino falls and the whole line starts to tumble? That’s cross-asset correlation in a nutshell. It’s the invisible thread connecting stocks, bonds, commodities, and currencies. When one moves, it sends a ripple—sometimes a tidal wave—through all the others.
For traders and portfolio managers, ignoring these connections is like sailing a stormy sea without a map. You might get lucky, but honestly, you’re probably just headed for a crash. Let’s dive into the techniques that can help you see these hidden links and, frankly, make smarter decisions.
Why Bother? The “Why” Behind the Math
It’s not just an academic exercise. In today’s globally connected markets, a political tremor in one country can shake the foundations of a tech stock portfolio halfway across the world. The 2008 financial crisis was a brutal masterclass in this. Everything that was supposed to be “diversified” suddenly moved in the same terrifying direction—down.
The core goal is simple: true diversification and smarter risk management. You don’t just want a bunch of different assets. You want assets that don’t all move in lockstep. When your stocks are down, you want something else in your portfolio to hold its ground or even rise. That’s the dream, right? That’s the power of understanding correlation.
The Core Toolkit: Essential Correlation Analysis Techniques
Okay, so how do we actually measure this stuff? Here’s a breakdown of the most common techniques, from the simple to the sophisticated.
1. Pearson Correlation Coefficient: The Classic Workhorse
This is the one everyone learns first. It measures the linear relationship between two assets. The result is a number between -1 and +1.
- +1: Perfect positive correlation. They move in the same direction, in perfect sync. Think two nearly identical tech stocks.
- 0: No linear correlation. Their movements are completely unrelated (which is incredibly rare).
- -1: Perfect negative correlation. When one goes up, the other goes down, like a perfect seesaw.
It’s a great starting point. But it has a blind spot. It assumes the relationship is steady and linear. And markets are anything but steady. A relationship that holds in a calm bull market can shatter in a volatile crash.
2. Rolling Correlation: Adding the Dimension of Time
This is where it gets more interesting. A rolling correlation doesn’t give you one static number. Instead, it calculates the correlation over a specific, rolling window of time.
Imagine you’re looking at the 60-day rolling correlation between gold and the US dollar. You’d see a line that moves up and down, showing you how their relationship has evolved. You can spot when a historically negative correlation breaks down or strengthens. This is vital because, well, correlations are not constants; they’re dynamic, living things.
3. Spearman’s Rank Correlation
Pearson cares about the precise values. Spearman’s is a bit more rugged. It looks at the rank order of the returns. This makes it a non-parametric test, which is a fancy way of saying it’s less fooled by extreme outliers or non-linear relationships that can skew Pearson’s results.
If your data is messy—and market data often is—Spearman can sometimes give you a more robust picture of the monotonic relationship (does one asset tend to go up when the other goes up, regardless of the exact amount?).
Beyond the Basics: Advanced Correlation Analysis Methods
For those who really want to get under the hood, there are more powerful engines available.
Dynamic Conditional Correlation (DCC-GARCH)
This one sounds complex, and it is, but the concept is brilliant. The DCC-GARCH model doesn’t just look at price movements; it specifically models how volatility spills over from one asset to another.
It acknowledges that in turbulent times, correlations tend to converge—often toward 1. Everything becomes correlated in a panic. This model helps you quantify that “volatility clustering” effect and see how the connections between assets change conditional on recent market turbulence. It’s a game-changer for stress-testing portfolios.
Copulas: Modeling the Tails
If DCC-GARCH is sophisticated, Copulas are the PhD-level stuff. Most models focus on the center of the distribution—the normal, everyday movements. Copulas are uniquely powerful for modeling the dependence structure in the tails—the extreme events.
They answer the critical question: “If Asset A has a catastrophic crash, what is the probability that Asset B will too?” This is the kind of analysis that can save a fund from a Black Swan event.
Putting It Into Practice: A Simple Example
Let’s make this concrete. Imagine you’re looking at a simple two-asset portfolio: an S&P 500 ETF (SPY) and a Long-Term Treasury Bond ETF (TLT). Historically, they’ve often had a negative correlation. Why? In “risk-off” environments, money flows out of stocks and into safe-haven bonds.
Here’s a hypothetical look at how their rolling 60-day correlation might shift:
| Period | Market Condition | Estimated SPY/TLT Correlation |
|---|---|---|
| Jan – Mar 2023 | Moderate Growth | Slightly Negative (-0.3) |
| Apr – Jun 2023 | Recession Fears | Strongly Negative (-0.7) |
| Jul – Sep 2023 | Market Rally | Weak Positive (+0.2) |
See how it changes? A static analysis would have missed this entire story. A static analysis would have, you know, given you a single, potentially misleading number.
The Inevitable Pitfalls & What to Watch For
This isn’t a magic bullet. Correlation is not causation—the oldest warning in the data book, but it bears repeating. Just because the price of avocados and a certain tech stock moved together for a year doesn’t mean one causes the other. It could be pure coincidence or a hidden, third factor driving both.
And then there’s structural break risk. A monetary policy shift, a new regulation, a geopolitical event—these can instantly rewire market relationships. The model you built last quarter might be useless today. Your analysis must be as dynamic as the markets you’re studying.
In fact, the biggest mistake is treating any correlation output as a permanent truth. It’s a snapshot, or better yet, a weather report. It tells you about current conditions, but it can’t always predict the hurricane.
Wrapping Up: The Big Picture
At the end of the day, cross-asset correlation analysis is about humility. It’s a tool that reveals the deep, often chaotic interconnectedness of the financial ecosystem. It reminds us that no asset is an island.
The real skill lies not in finding a perfect number, but in interpreting the ever-shifting tapestry of relationships. It’s about listening to what the market is whispering—about risk, about fear, about greed—through the silent language of co-movement. And in a world of constant flux, that’s a language worth learning.


