How to Analyse the Investment Market History
2 min read
An investment market history is an invaluable tool for traders and investors. This information can help traders and investors understand market trends and preserve opportunities for future growth. When performed properly, historical data analysis can provide investors with valuable information about the market’s history. Financial data mining and backtesting techniques are effective tools for this purpose. The insights they provide can help investors develop and improve existing trading methods. Using these techniques can yield significant rewards for investors.
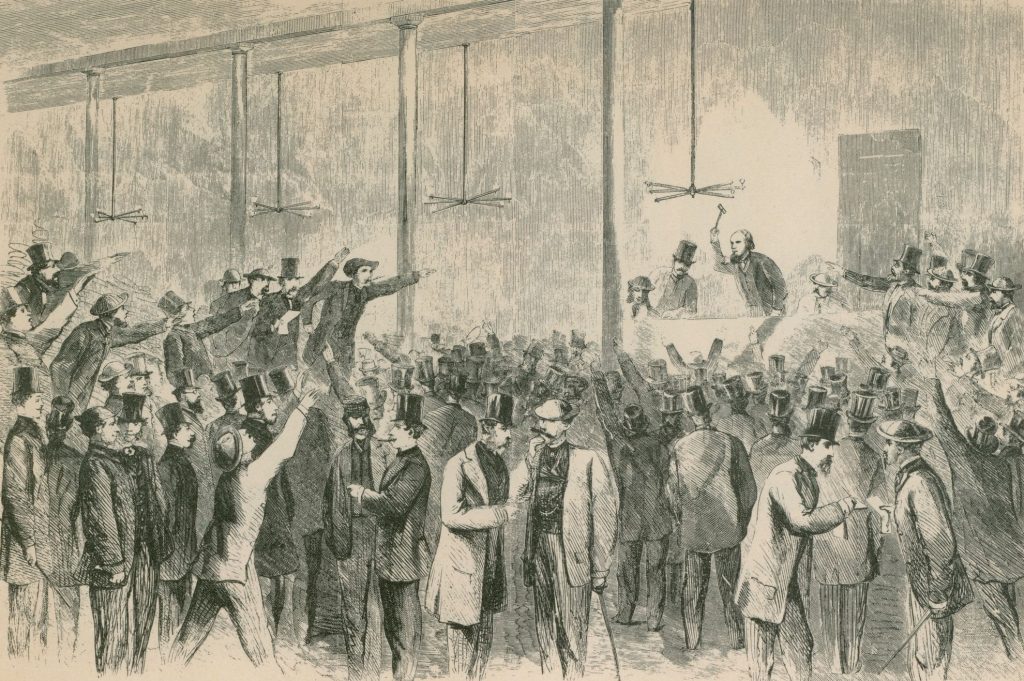
Until the mid-1960s, the most common way to analyse the investment market’s history was through the use of tape reading, a technique that involved reading market information from a paper strip or stock ticker. These signals were transmitted to brokerage houses and active speculators’ homes. The development of computer technology and electronic information panels, however, rendered tape reading obsolete. Today, computer-aided techniques are used to analyse the history of the investment market.
A technical analyst studies the price movements of stocks or commodities using chart patterns. Price movements tend to repeat in the same manner over time. This is based on the premise that history repeats itself. Despite changes in economic conditions and fresh events, price patterns are often similar. The same goes for predicting market trends. With technical analysis, price movements are often repetitive. The premise is that the price of a security represents all relevant information. In this way, fundamental analysis is unnecessary.
Technical analysis involves models based on price transformations and volume patterns. Using these charts, analysts can forecast future trades. The bread and butter of technical analysis is chart patterns. Chart patterns help determine the direction of a stock’s movement. When interpreting charts, technical analysts use chart patterns to make their predictions. This is a valuable tool for stock market enthusiasts. You can also use this type of analysis to determine the future performance of your investment.
The history of markets is vital in identifying the best time to invest in particular stocks. Observing price trends for several months or even a decade can give you valuable insights into how the market works. The primary market trend, for example, lasts for one to three years while the secular trend, which can last for decades, has a much longer duration. This type of trend sends business reporters into a spin as it moves markets in opposite directions.


